Nitrate in groundwater

Nitrate exceeds the limit value of 25 mg/l in groundwater at 15% of monitoring sites across Switzerland. In areas where arable farming is predominant, concentrations are above the limit at nearly 50% of monitoring sites.

Groundwater contains very little nitrate naturally. For groundwater used for drinking water or intended for such use, the Waters Protection Ordinance (WPO) prescribes a limit value ('numerical requirement') of 25 milligrams per litre (mg/l). In the last ten years, this limit has been exceeded at up to 18% of NAQUA National Ground Monitoring sites nationwide.

Nitrat_2022_Karte_Internet_EN
Nitrate in groundwater and open arable land. Data: NAQUA 2022.
© FOEN

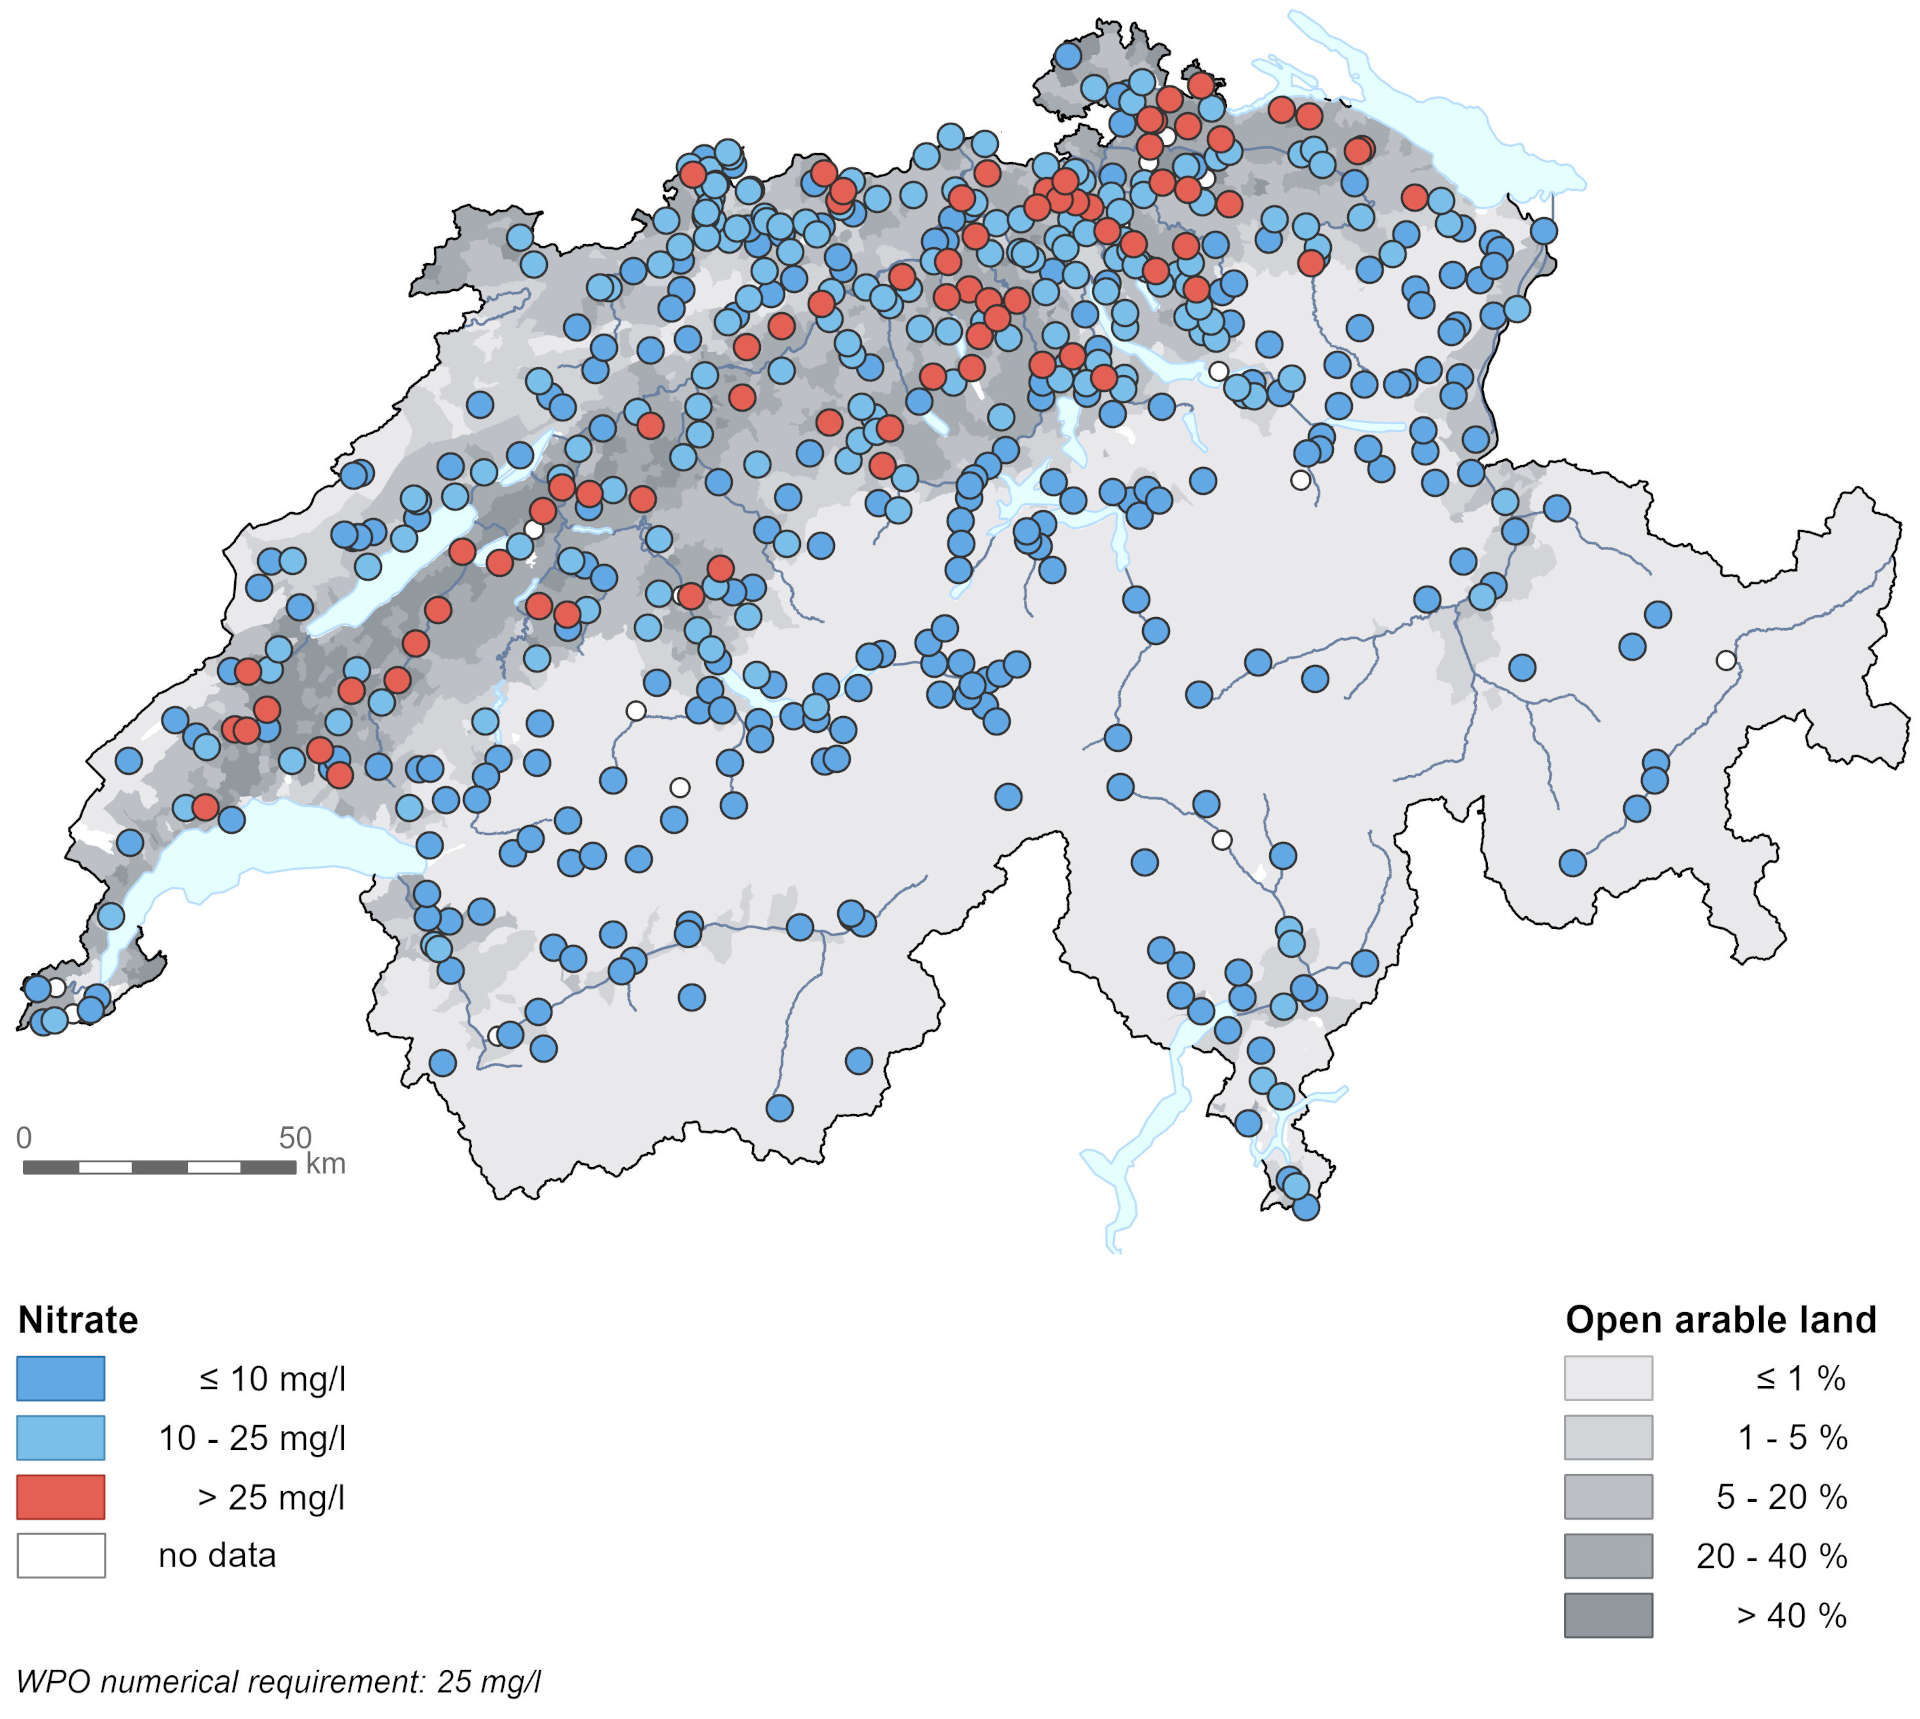
Frequent exceeding of the limit value in arable farming areas

Elevated nitrate concentrations in groundwater are mainly due to intensive agriculture. In areas used primarily for growing arable crops or vegetables, close to 50% of monitoring sites exceed the limit value of 25 mg/l. On the Swiss Plateau concentrations are above 10 mg/l at around 80% of monitoring sites.

After a slight decline of the number of monitoring sites exceeding the limit value in groundwater during several years, this number increased again between 2016 and 2021. This increase was particularly pronounced in areas with vegetable crops and arable land, where there is a lot of excess nitrogen in the soil. In these areas, levels have increased for five years in a row.

Percentage of the NAQUA monitoring sites at which the numerical requirement of the Waters Protection Ordinance is exceeded 2022: 14.6 Percentage of the NAQUA monitoring sites at which the numerical requirement of the Waters Protection Ordinance is exceeded 2021: 18.2 Percentage of the NAQUA monitoring sites at which the numerical requirement of the Waters Protection Ordinance is exceeded 2020: 14.8 Percentage of the NAQUA monitoring sites at which the numerical requirement of the Waters Protection Ordinance is exceeded 2019: 14.6 Percentage of the NAQUA monitoring sites at which the numerical requirement of the Waters Protection Ordinance is exceeded 2018: 13.3 Percentage of the NAQUA monitoring sites at which the numerical requirement of the Waters Protection Ordinance is exceeded 2017: 12 Percentage of the NAQUA monitoring sites at which the numerical requirement of the Waters Protection Ordinance is exceeded 2016: 12.8 Percentage of the NAQUA monitoring sites at which the numerical requirement of the Waters Protection Ordinance is exceeded 2015: 13.5 Percentage of the NAQUA monitoring sites at which the numerical requirement of the Waters Protection Ordinance is exceeded 2014: 13.4 Percentage of the NAQUA monitoring sites at which the numerical requirement of the Waters Protection Ordinance is exceeded 2013: 15.3 Percentage of the NAQUA monitoring sites at which the numerical requirement of the Waters Protection Ordinance is exceeded 2012: 14.1 Percentage of the NAQUA monitoring sites at which the numerical requirement of the Waters Protection Ordinance is exceeded 2011: 16.4 Percentage of the NAQUA monitoring sites at which the numerical requirement of the Waters Protection Ordinance is exceeded 2010: 16.2 Percentage of the NAQUA monitoring sites at which the numerical requirement of the Waters Protection Ordinance is exceeded 2009: 16.8 Percentage of the NAQUA monitoring sites at which the numerical requirement of the Waters Protection Ordinance is exceeded 2008: 16.5

Data for the graph: Excel
Source: National Groundwater Monitoring NAQUA


Both hydrological and various agronomic factors are possible drivers of the increase of the nitrate concentrations under cropland. Clarifications are underway.

Further information

Contact
Last modification 03.05.2024

Top of page

https://www.bafu.admin.ch/content/bafu/en/home/topics/water/info-specialists/state-of-waterbodies/state-of-groundwater/groundwater-quality/nitrate-in-groundwater.html