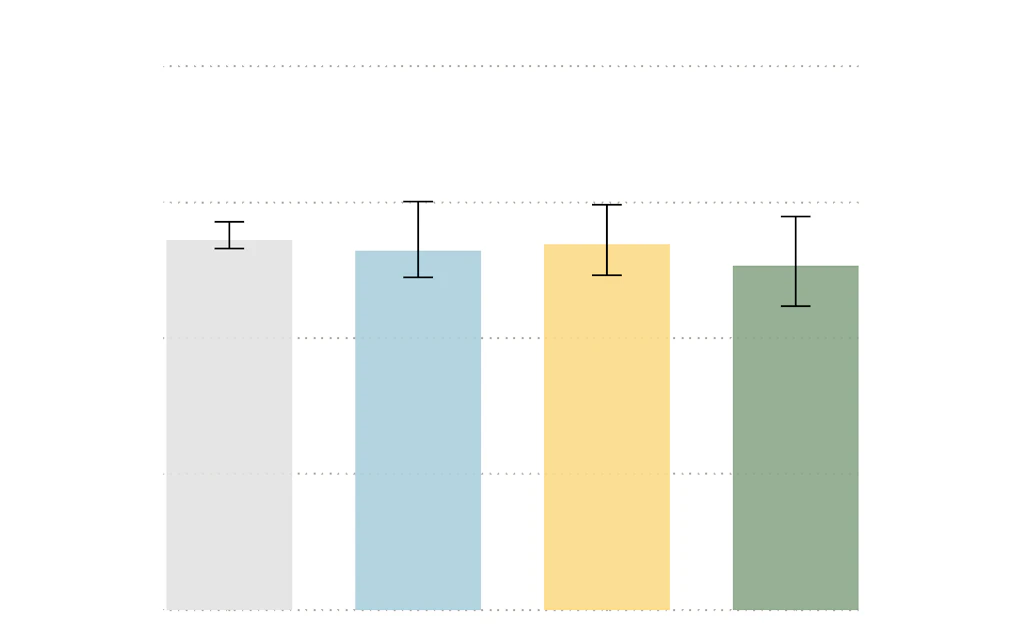
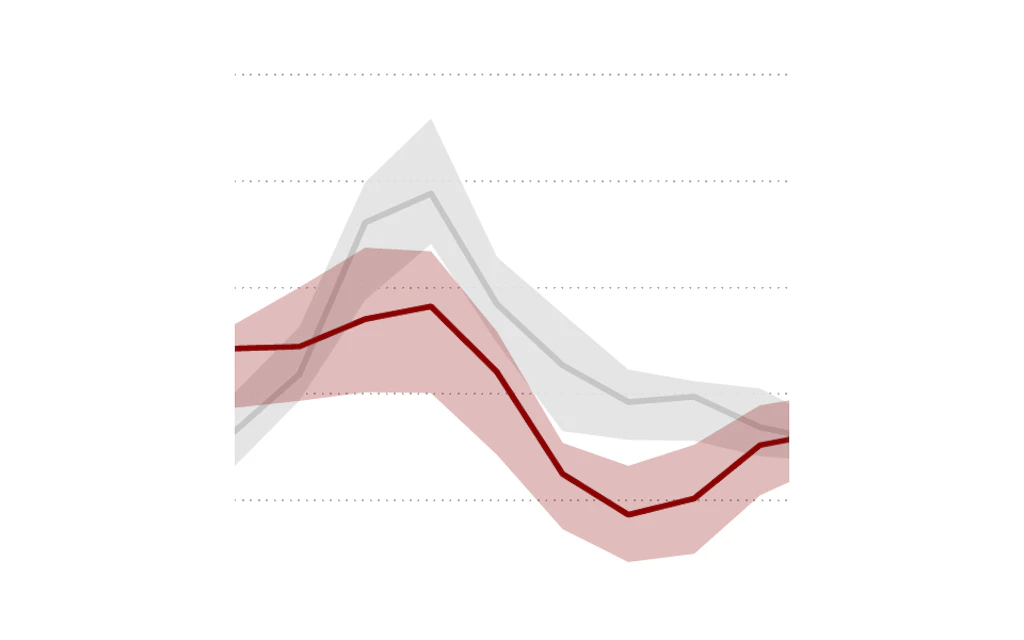
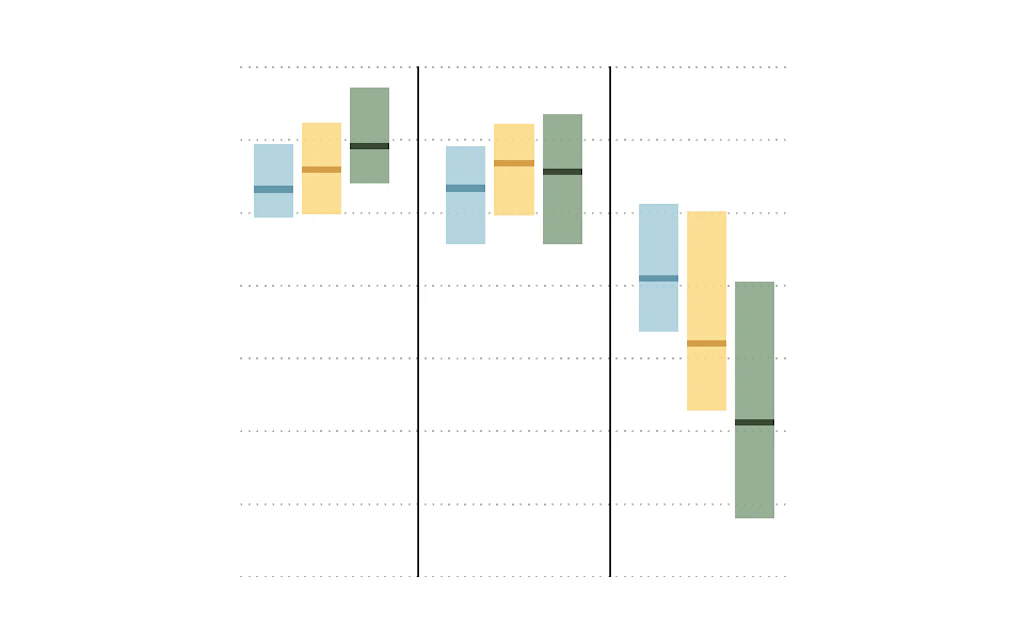
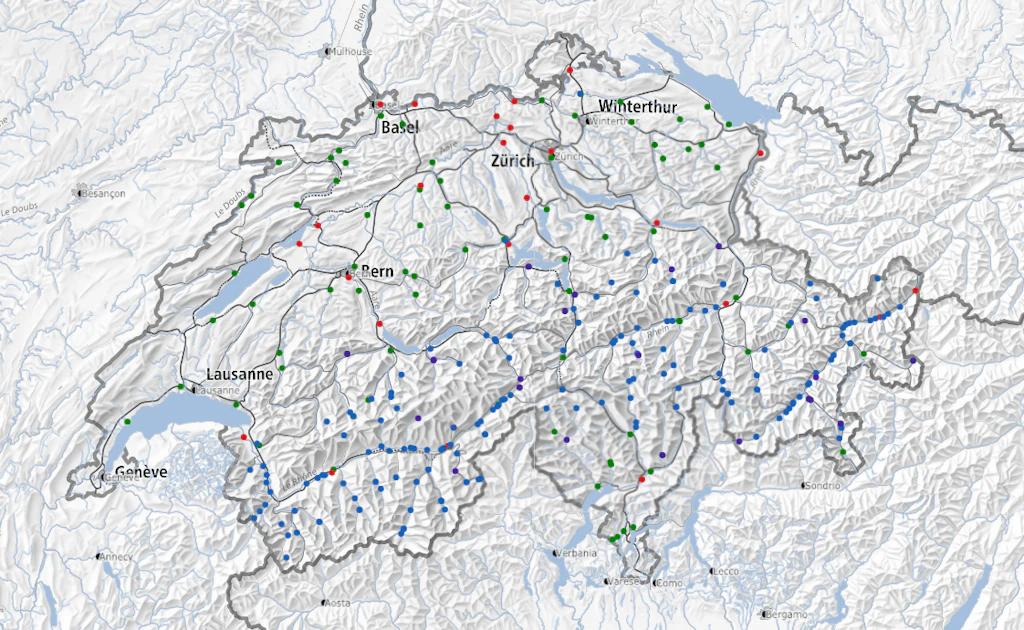
Explore the results of the new Swiss climate scenarios for yourself with the web atlas. The web atlas offers graphics and data for numerous locations and regions, as well as seasons and global warming levels.
The Climate CH2025 web atlas offers a collection of data and graphics on future climate development in Switzerland. The web atlas displays thousands of interactive graphics on various climate indicators and can be viewed for the observation period (reference period 1991-2020) and for the three global warming levels (GWL1.5, GWL2.0, GWL3.0). Both maps and diagrams are available. In addition, for the two basic variables temperature and precipitation, a type of graphic is offered that makes it possible to view the change signals in the context of three future time periods (2040, 2050, and 2060).
All graphics are available in four languages and can be downloaded together with the corresponding data.
The Hydro-CH2018 web atlas graphics are provided under the CC BY 4.0 license.
Among others, this means that users are allowed to share (copy and redistribute) and adapt (remix, transform, and build upon for any purpose, even commercially) the data and graphics, under the condition that proper reference is given to the Hydro-CH2018 hydrological scenarios. Please note also that all material is provided without any warranties and guarantees.
Chart types
Indicators at stations
Climate chartes
Seasonal changes
The datasets contain modeled mean runoff changes (absolute and relative) for different emission scenarios and different time horizons at monthly, seasonal, and annual resolution at selected stations or sites:
Data set L01: Runoff from mesoscale catchments at selected stations
Changes in mean monthly, seasonal, and annual runoff for three emission scenarios (RCP2.6, RCP4.5, and RCP8.5) for three future time periods: 2035 (2020-2049), 2060 (2045-2074), and 2085 (2070-2099). The focus of this dataset is on mesoscale catchments (10-1700 km2).
Citation:
Muelchi, R., Roessler, O., Schwanbeck, J. und Martius Romppainen, O. An ensemble of daily simulated runoff data (1981–2099) under climate change conditions for 93 catchments in Switzerland (Hydro-CH2018-Runoff ensemble). Geoscience Data Journal, https://doi.org/10.1002/gdj3.117, 2021
Data set L02: Runoff from macroscale catchments at selected stations
Changes in mean monthly, seasonal, and annual runoff for three emission scenarios (RCP2.6, RCP4.5, and RCP8.5) for three future time periods: 2035 (2020-2049), 2060 (2045-2074), and 2085 (2070-2099). The focus of this dataset is on macroscale catchments (>1000 km2).
Citation:
Massimiliano Zappa, Florian Lustenberger, Rolf Weingartner, Alain Bühlmann, Regula Mülchi (2021). “Mean discharge of large catchments”. In Hydro-CH2018: Scenarios to 2100. Hydrological Atlas of Switzerland.
Data set L03: Runoff from glaciated headwater catchments at selected sites
Changes in mean monthly, seasonal, and annual runoff for three emission scenarios (RCP2.6, RCP4.5, and RCP8.5) for three future time periods: 2035 (2020-2049), 2060 (2045-2074), and 2085 (2070-2099). The data set focuses on snow and glacier ice melt.
Citation:
Daphné Freudiger, Marc Vis, Jan Seibert (2021). “Mean discharge of glaciated catchments”. In Hydro-CH2018: Scenarios to 2100. Hydrological Atlas of Switzerland.
The maps compiled in this dataset contain gridded (500mx500m) mean monthly and annual discharges for three emission scenarios (RCP 2.6, RCP4.5, and RCP8.5). The maps are available for three time horizons in the future: 2035 (2020-2049), 2060 (2045-2074), and 2085 (2070-2099). In addition, the maps for the reference period (1981-2010) and the results of the control run are also included. The files are available as ASCII grids, without lakes with reference system CH1903_LV95.
Within the framework of Hydro-CH2018, various research projects were carried out. An overview of all projects and the most important results can be found here: