
Switzerland is rich in water, but climate change is changing this. Droughts not only affect vegetation and rivers, but also groundwater. The FOEN monitors the effects of drought on Switzerland's natural groundwater bodies and helps to develop sustainable strategies for managing these valuable resources.
Reduced groundwater recharge during droughts
Groundwater is naturally recharged by precipitation, snowmelt and rivers. The water permeates the ground and fills the cavities in porous or fractured rock formations, which serve as aquifers.
During droughts, however, significantly less precipitation falls over several weeks, reducing groundwater recharge. For this reason, groundwater resources that are predominantly fed by precipitation are more affected by droughts than resources with additional river water infiltration. Rivers carrying meltwater are particularly important for such groundwater resources, as melting snow and glaciers in spring and summer contribute to the formation of new groundwater and can thus mitigate the effects of drought. However, if rivers also carry little or no water during long periods of drought and heat, the additional groundwater recharge from river water also ceases.
The extent to which drought affects groundwater quantity also depends on the natural properties of the subsurface, as well as the depth and thickness of the groundwater aquifer. The principal groundwater resources that react sensitively to drought are:
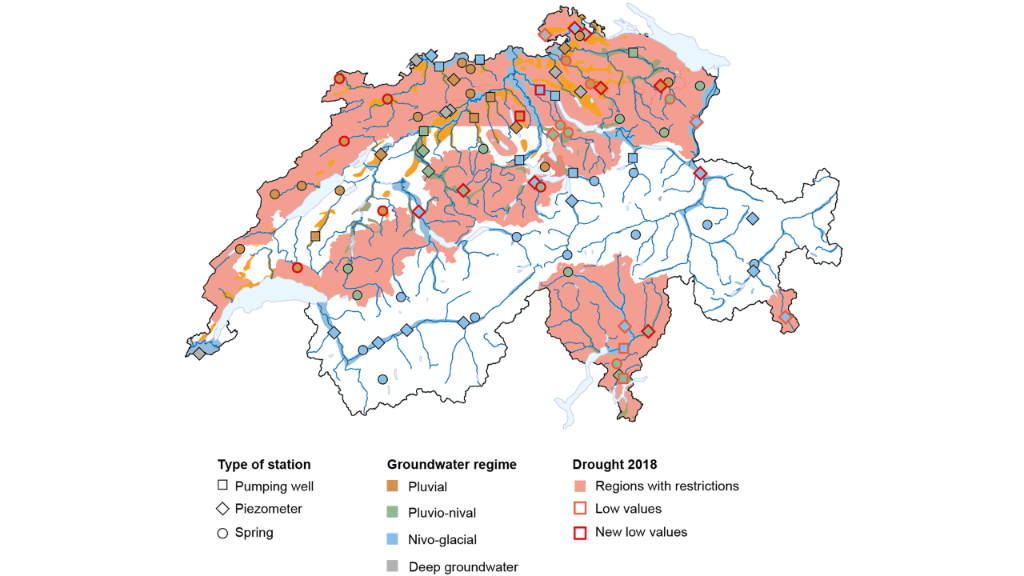
- Localised, i.e. very limited in terms of space, unconsolidated groundwater reserves with or without a connection to small watercourses with a pluvial groundwater regime in the Jura mountains and Swiss Plateau
- Local groundwater reserves in the molasse rock of the Swiss Plateau and in the karst of the Jura mountains and the northern and southern Pre-Alps
These regions recorded new lows in groundwater levels and spring discharges during the dry summer of 2018, as shown in the map below.

Important groundwater functions in dry periods
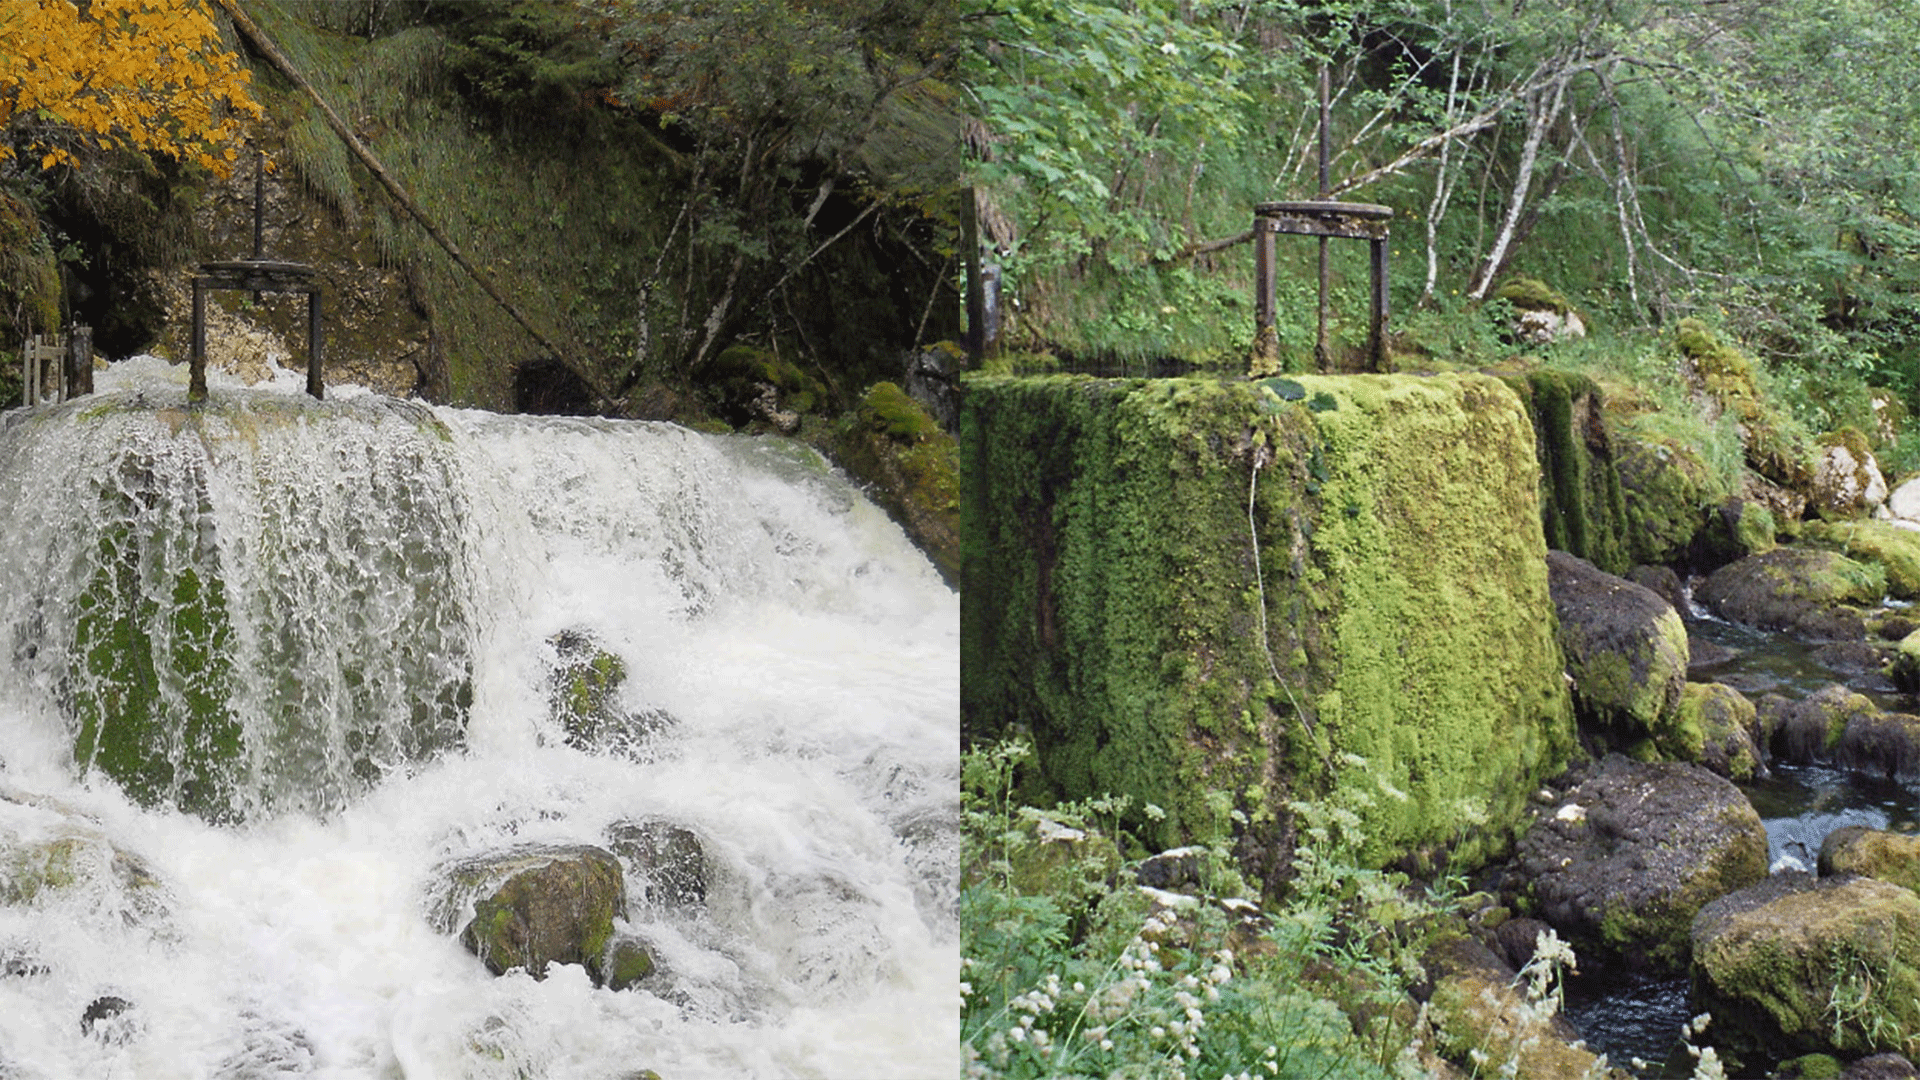
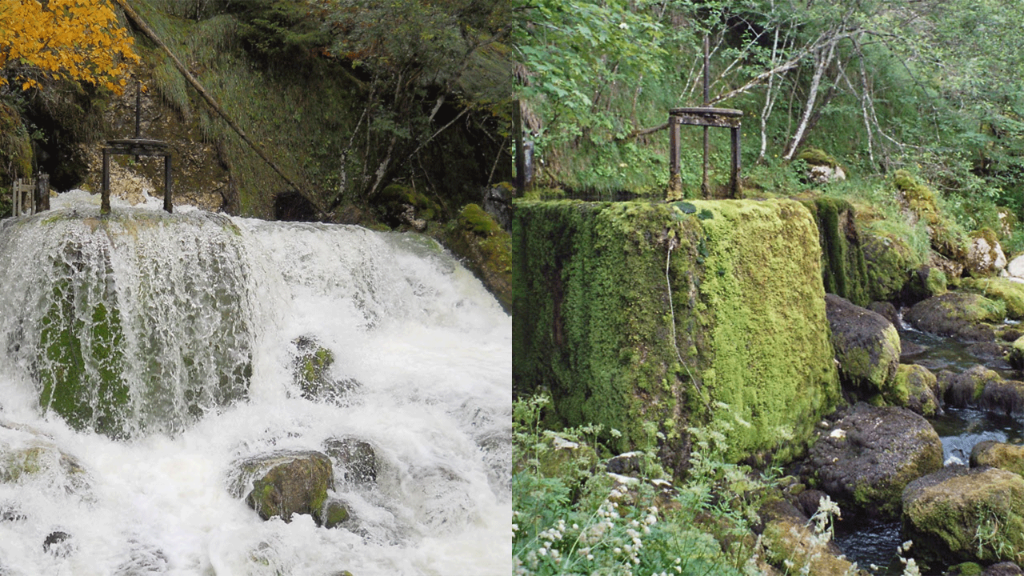
In low-flow conditions, it may no longer be the watercourses that feed the groundwater, but the groundwater that feeds the watercourses. Sufficient groundwater is therefore essential to maintain the low-flow discharge of small and medium-sized watercourses. Similarly, groundwater-dependent terrestrial ecosystems, such as wet meadows, moors and floodplain forests, depend on the presence of groundwater close to the surface. It has been shown that these ecosystems are more severely affected by dry periods than our water supply, which can draw on deeper groundwater resources in such times.
During droughts, more groundwater is used for agricultural irrigation, cooling and drinking water supply. This additional extraction increases the pressure on groundwater resources and can have a greater regional impact on groundwater reserves than the direct effects of climate change. This is usually not a problem for short periods, since droughts usually affect groundwater only after a few days or weeks. However, it can become a problem if the drought lasts longer than a few weeks or recurs over several years. This can lead to long-term groundwater depletion.
Monitoring groundwater
Climate change is expected to lead to longer and more frequent dry spells, making nationwide monitoring of the effects on groundwater indispensable. As part of Switzerland's national groundwater monitoring programme (NAQUA), groundwater volume and temperature are monitored continuously at around 100 sites.
The following FOEN indicators provide information on the state and development of groundwater, particularly during dry periods (low groundwater levels and low spring discharge, or high groundwater temperatures):


Further information
Links
Documents
Effect of Climate Change on Groundwater Quantity and Quality in Switzerland (PDF, 6 MB, 30.12.2021)Commissioned by the Federal Office for the Environment FOEN
Niedrigwasser und Grundwasser Synthesebericht (PDF, 3 MB, 01.12.2018)Im Auftrag des BAFU
Last modification 26.11.2024

