
The mean monthly and annual discharge values are the classical parameters for the discharge regime of a watercourse. The FOEN makes available current and projected data for the whole of Switzerland in a number of datasets.
A data package contains 13 datasets: one dataset for the mean annual discharge values and twelve for the monthly values. The data provides a basis for estimating discharge in areas where no measurements are made.
There are packages containing raster datasets relating to the present day (MQ-CH, reference period 1981–2000) and a dataset package in which the information from MQ-CH is mapped onto Switzerland’s watercourse network and thus provides discharge data for river sections (MQ-GWN-CH).
In the CCHydro and Hydro-CH2018 projects, raster datasets were updated for the present day and the future.
Mean monthly and annual discharge: future scenarios
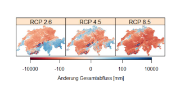

In this dataset, the maps compiled from the Hydro-CH2018 project contain the gridded (500 x 500m) mean monthly and annual discharge for three emission scenarios (RCP 2.6, RCP4.5 and RCP8.5). The maps are available for three time horizons: 2035 (2020–2049), 2060 (2045–2074) and 2085 (2070–2099). The maps for the reference period (1981–2010) and the results of the modelling control run are also included.
Dataset acces:
NCCS: Raster data set: mean monthly and yearly discharge (Hydro-CH2018)
Dataset and accompanying information
Previous datasets with future scenarios:
A data package for the period 1980–2009 and two future mean annual and monthly discharge scenarios was generated from the CCHydro project (predecessor project of Hydro-CH2018).
Information can be found in the synthesis report entitled Effects of Climate Change on Water Resources and Waters, pp.16 to 21.
Mean monthly and annual discharge
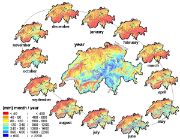

A dataset contains the mean natural discharge for the period 1981–2000 for each grid cell (500 x 500m). The article below (in German) provides information on how the dataset was created, the area of application, the application limits and the expected accuracy:
Dataset access
In addition to the datasets, the zip file contains the terms of use, the recommended form of citation, metadata and a description of the dataset. It also provides information on the scope and limits of application and on the expected accuracy of the data.
Mean monthly and annual discharge (MQ-CH) (ZIP, 9 MB, 15.03.2013)in ASCII and ESRI raster formats
Mean discharge values and discharge regime type for the river network in Switzerland
Present-day mean natural monthly and annual discharge (reference period 1981–2000) was modelled for the Swiss river network and the associated discharge regime types were determined. The resulting dataset is named MQ-GWN-CH.
The dataset provides information on the average discharge behaviour of watercourses in Switzerland. It contains both the simulated natural discharge amounts (modelling basis: 1981–2000) which can be expected as an annual or monthly average, and the discharge regime type. Each data item is linked to a specific section of a watercourse.
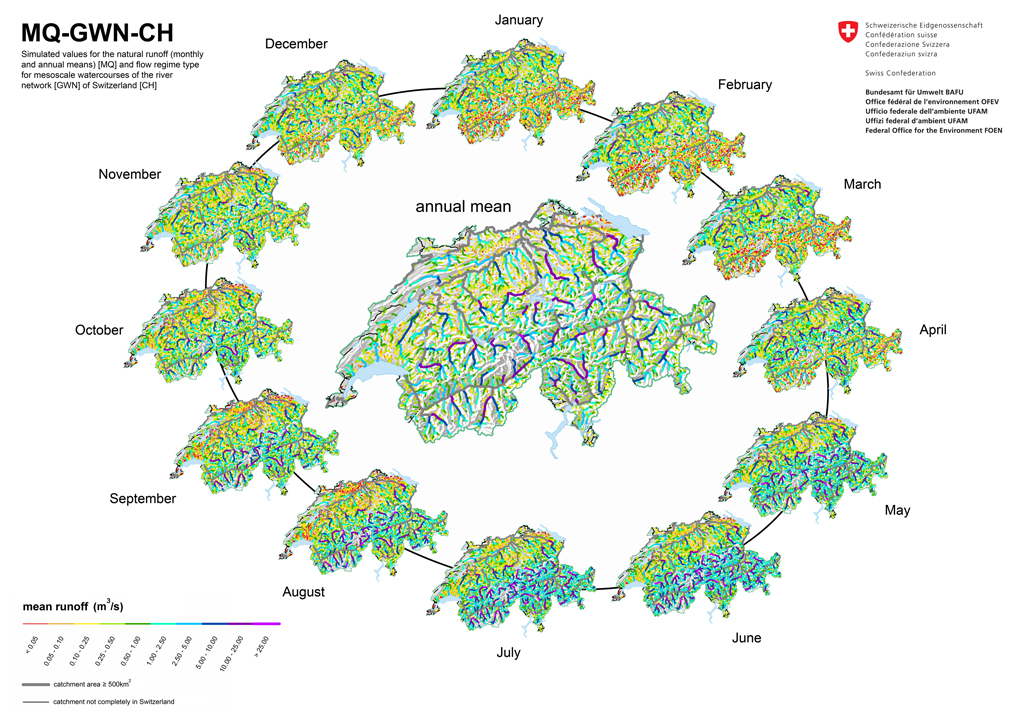
MQ-GWN-CH provides a comprehensive data basis on mean discharges for medium-sized watercourses. No discharge values are provided for watercourses with catchment areas smaller than 3km2 (application limit of the underlying discharge volume dataset) or larger than or equal to 500km2 (for the latter, it is assumed that applicable discharge monitoring stations are generally available). In general, measurements from hydrometric stations provide a better data basis.
The dataset is available as a shapefile and as a table which can be linked to the swisstopo map of the Swiss watercourse network at a scale of 1:25,000 (gwn25-2007).
Dataset access
In addition to the dataset, the zip file contains product documentation providing information on the methodology used to create MQ-GWN-CH, a description of the data and the application possibilities and limitations. It also contains the terms of use and cartographic visualisations of the results.
Mean discharge rates (MQ) for the watercourse network (GWN) in Switzerland (ZIP, 21 MB, 07.03.2025)Data status 2013
Further information
Last modification 07.03.2025

