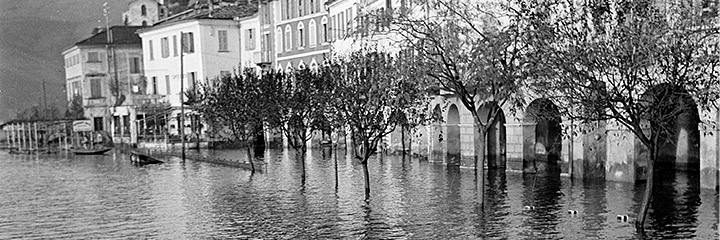
The FOEN evaluates statistics on flood events and makes the findings available to the public.

The data from the federal discharge measurement network are systematically evaluated in order to compile flood statistics. In doing so, the FOEN works with the method set described in the following article in German:
Hochwasserstatistik am BAFU – Diskussion eines neuen Methodensets (PDF, 791 kB, 07.04.2014)Artikel in "Wasser Energie Luft" 2/2013
1. Publication of the results
The results are published in two stages:
- A result sheet is published for all the current discharge measurement stations; this can be used for initial approximate flood probability estimates.
- For selected stations, detailed station reports can be downloaded. These are mainly intended for organisations specialising in hydrology, for use as a basis for more detailed studies.
2. Contents of result sheets
The maximum annual discharges (checked for plausibility) are used to produce the result sheets. The return levels (discharges for specific return periods) are calculated using the generalized extreme value distribution (GEV).
The front of the result sheet shows on the one hand the annual peak discharge measurement series as a bar chart and on the other the flood probabilities with the estimated distribution function and the measured data as a return level plot. Two tables also list the estimated return levels for the return periods T = 2, 10, 30, 100 and 300 and the five highest annual maximum discharges with their estimated return periods. The back of the sheet contains a range of further information.
The result sheets are used for initial rough estimates of the flood probabilities. Further considerations (e.g. on flooding) are not possible within the framework of these routine assessments. With regard to a specific design situation, more comprehensive studies are required.
Hydrological data and forecasts
3. Contents of the station reports
The station reports are used to detect any non-stationarity in the data, to gain an overview of the discharge quantities calculated using two different approaches for predetermined return periods and to be able to evaluate the difference between them.
In addition to the purely statistical analysis of the flood data, the station reports also contain approximate evaluations of the station's historical metadata and any influences in the catchment area. These should make it possible to optimally embed the statistical results in a specific context.
The results of these statistical analyses only form the basis for answering specific questions, e.g. in determining design discharge. Knowledge of the hydrological processes in the catchment area, considerations of worst-case scenarios for precipitation and runoff etc. are essential for assessment of the flood risk.
4. Non-statistical procedures
Flood statistics have methodological limitations. For example, when collecting discharge data, a sample is taken that is only representative to a limited extent of the actual behaviour of a given watercourse. This means that only return periods that are at most two or three times the length of the measurement series should be calculated. For rarer events, other procedures must be used. The study on extreme floods on the Aare [Extremhochwasser an der Aare] provides this form of data for the Aare catchment area.
A comparison with observed extreme discharges can be helpful to establish how realistic the return values calculated with the help of flood statistics are. The inventory of large flood discharges in Swiss catchments enables such a comparison.
Further information
Documents
Szenarien für die extremen Hochwasser des Rheins bei Basel (PDF, 7 MB, 08.11.2006)Studie im Auftrag des Bundesamts für Wasser und Geologie, 2004
Last modification 17.12.2021


