
The cadastres display the emissions and removals based on Switzerland’s greenhouse gas inventory distributed geographically on the Swiss territory. The maps do not reflect individual measurements, but are based on a distribution of the results for the whole of Switzerland according to the greenhouse gas inventory, using simple assumptions for locating the sources and sinks of greenhouse gases.
General information on compiling the cadastres is available in the following reports:
Emissionskataster Schweiz 2015 Treibhausgase und Luftschadstoffe (PDF, 1 MB, 06.05.2021)Im Auftrag des BAFU
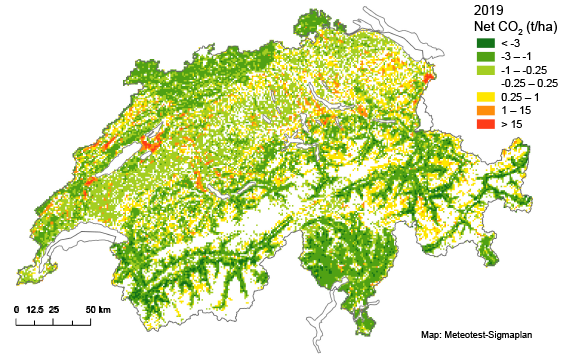
The maps below show the cadastres of various greenhouse gas emissions (CO2, CH4, N2O and synthetic gases) for the year 2015. The last map shows the cadastre for biogenic CO2 from land use for the year 2019.
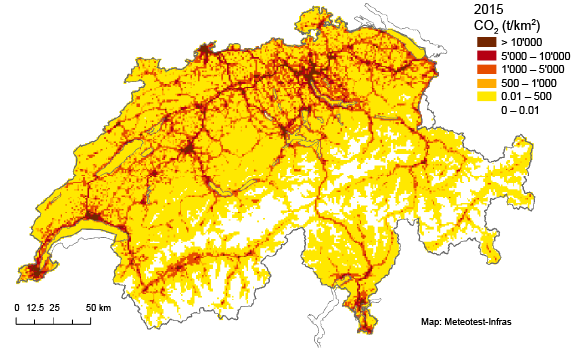
Carbon dioxide (CO2)
CO2 emissions are primarily generated along the road network (transport) and in built-up areas (households, services, industry). Major point sources are cement plants, waste incineration plants and other large industrial plants (refinery, chemical industry, metal, wood and food industry, etc.). Biogenic CO2 emissions or CO2 removals from the atmosphere are not reflected here, they are presented separately below under "Land use".
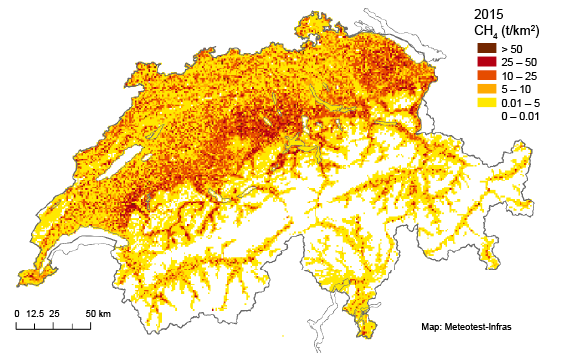
Methane (CH4)
CH4 emissions mainly arise from cattle farming and manure management and hence occur in rural areas (stables, pastures). Other important sources are old landfills, the gas network and wastewater treatment plants.
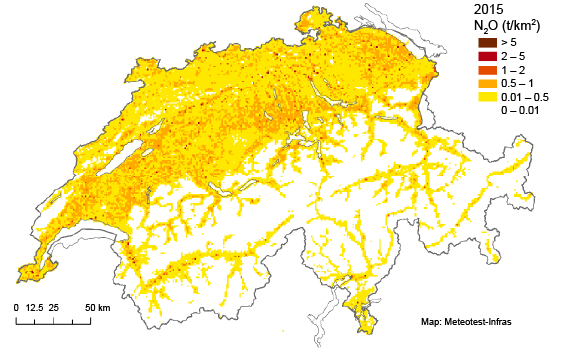
Nitrous oxide (N2O)
The main source of N2O emissions is agriculture. The emissions arise from the use of fertilisers and from farmyard manure management (agricultural land, stables). Major emissions also come from individual chemical plants and from wastewater treatment plants.
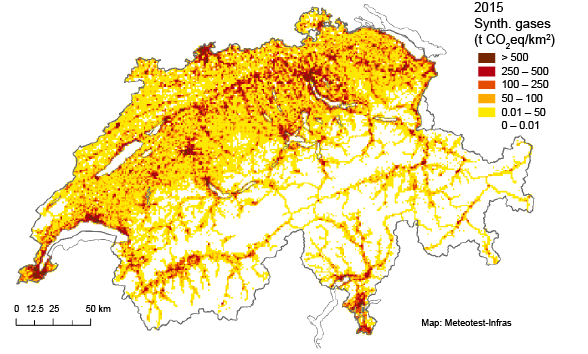
Synthetic gases
Synthetic gas emissions mainly arise from the loss of refrigerants from cold-storage rooms, refrigerators and air conditioning units. As a result, they occur in populated areas (stationary cooling facilities) and along the road network (mobile air conditioning systems).
Land use (biogenic CO2)
The map shows the CO2 balance of vegetation and soils in tonnes of CO2 per hectare for the year 2019 on a grid of one square kilometre. A positive sign corresponds to a net emission of CO2, a negative sign means that more CO2 was removed from the atmosphere than was emitted (carbon sink).
Most forests remove CO2 from the atmosphere; the highest rates are achieved in the Alpine region due to the comparatively low timber harvest. In contrast, agriculturally used organic soils (former peatlands) emit the most CO2 per unit area.
Further information
Documents
Last modification 12.01.2024

